
The Difference Between a Loading Spinner and a Winning Six
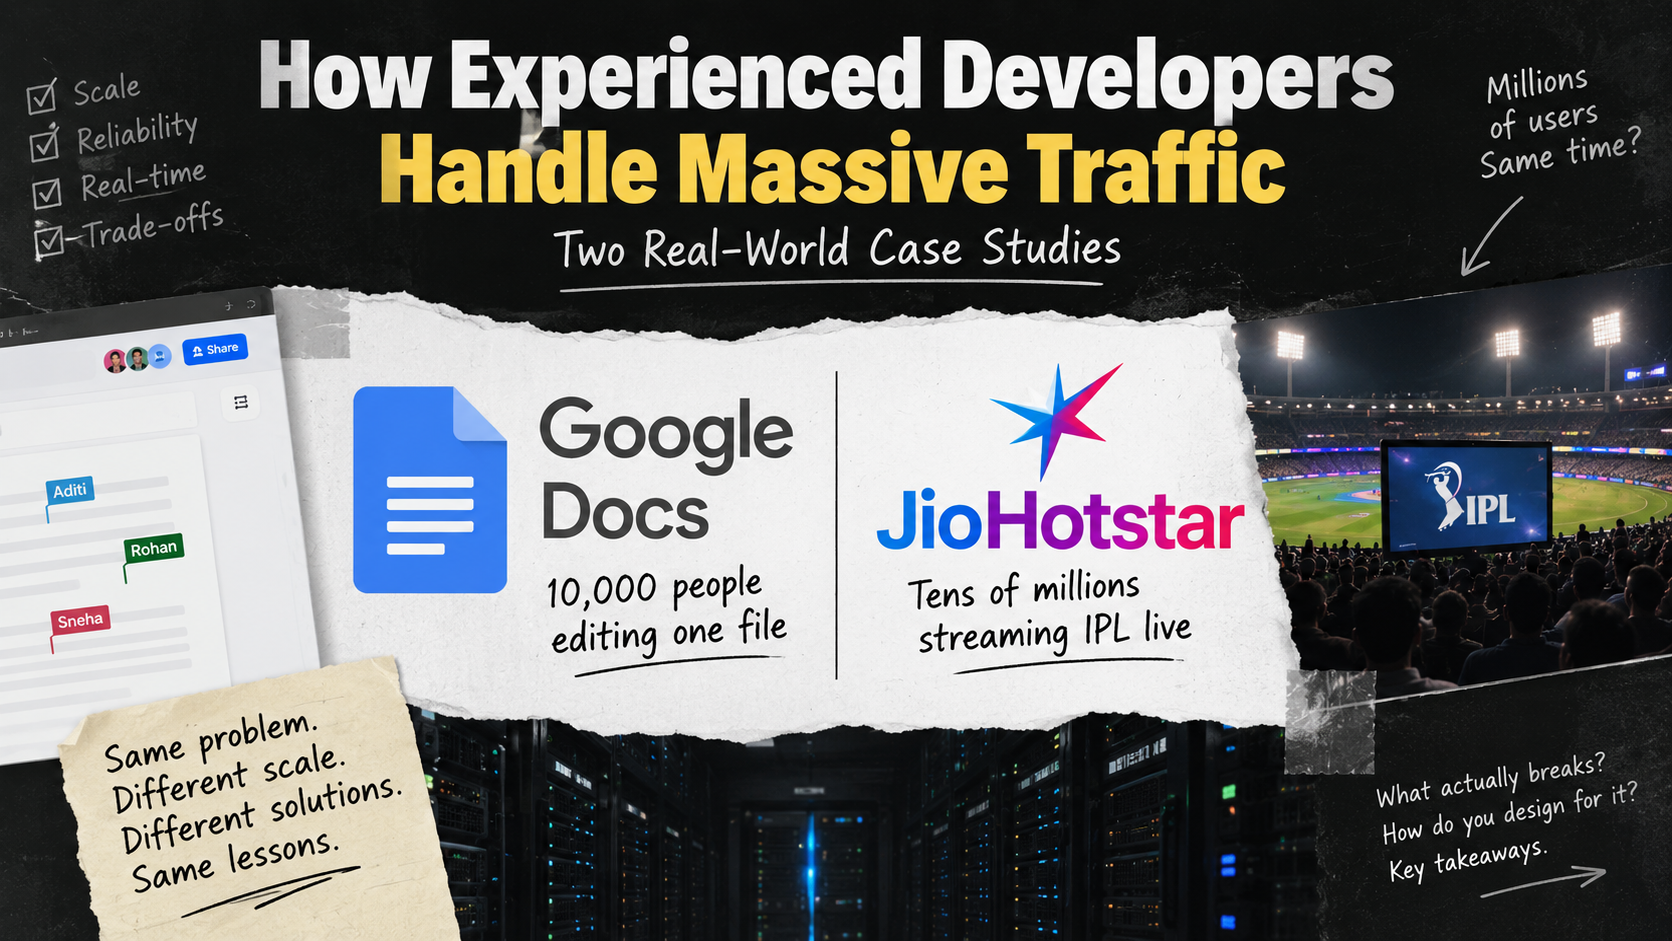
There is a huge difference between building an app that works for a few hundred users and building a system that stays alive when millions of people hit it at the exact same time. The difference is not just about adding more servers. It is about understanding what actually breaks when traffic explodes, designing your system to fail gracefully instead of crashing completely, and making smart trade-offs that focus on the right things for the right workload.
In this blog, we will look at two very different systems that operate at crazy scale. First, Google Docs, which handles real-time editing where thousands of people can edit the same document at once. Second, JioHotstar, which streams live cricket to tens of millions of people watching the IPL Final at the same time.
By breaking down how these systems are built, we can pull out lessons that apply to any high-traffic application. More importantly, we will understand how an experienced engineer thinks about these problems, and how a fresher can learn to approach them properly instead of just "vibe coding" and hoping for the best.
Case Study 1: Google Docs and 10,000 People Editing a Single File
The Problem
Imagine 10,000 people editing the same document at the same time. Every single keystroke from every single user is a potential conflict. If User A types "Hello" at position 5 while User B deletes "World" at position 12, how does the system sort this out without messing up the document? And how does it do this in milliseconds so that all 10,000 users see the same thing?
This is not an easy problem. Most systems would simply crash under this kind of load. Google Docs handles it, and understanding how is a masterclass in distributed systems design.
The Architecture: Operational Transformation with Server-Ordered Logs
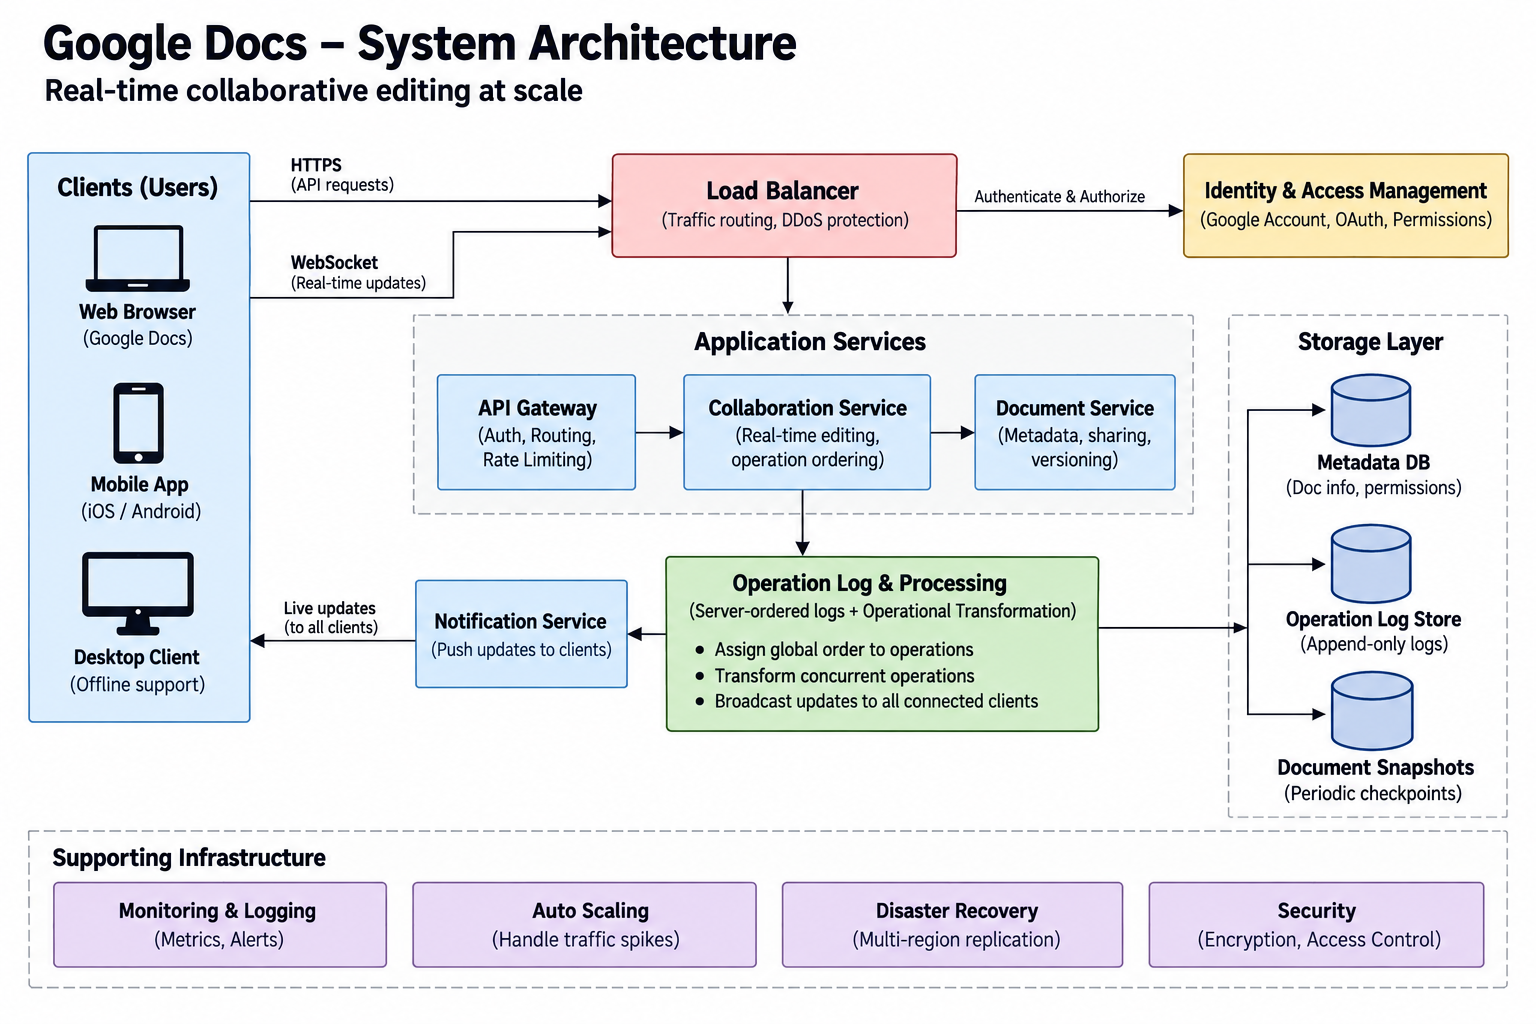
Google Docs uses something called Operational Transformation, or OT for short. Let me explain this in simple terms.
Every change a user makes, whether it is typing a letter, deleting a word, or adding formatting, is treated as an "operation." When you type a character, that operation is sent to Google's servers. The server acts like a referee. It decides the official order of every operation and then broadcasts that ordered list to everyone who is connected.
The key insight here is that clients do not send the full document back and forth. They only send small descriptions of what changed. This keeps the data being sent over the network very small, which means the system can handle a lot of operations without choking the network.
When your computer receives operations from other users, it has to adjust its own pending operations to account for the changes that have already happened. This is the "transformation" part of Operational Transformation. If I inserted a character at position 10, and then someone else inserted a character at position 5, my operation needs to shift to position 11 before it can be applied. The server decides the order, and your computer transforms your changes to match that order.
Google Docs also uses something called server-ordered logs with periodic checkpoints. Instead of storing the document as one big blob of data that gets overwritten, the system appends every operation to a log. The document is rebuilt by replaying this log from a checkpoint. This append-only approach makes the system very resilient. If a server crashes, it can rebuild its state by replaying the log from the last checkpoint.
The Trade-Offs
This architecture makes some specific trade-offs that are important to understand.
First, having a central server that orders operations creates a bottleneck. The server that owns a document becomes a single point of failure until ownership transfers to another server. Google handles this by spreading documents across many servers, but for one very popular document, there is still a limit to how many operations a single server can handle per second.
Second, offline support is limited. Because operations need a round-trip to the server to be ordered and broadcast, true offline editing is difficult. Your computer can buffer local changes, but when you come back online, the server still needs to reconcile everything.
Third, there are real-world performance limits. Academic research on Google Docs found that end-to-end latency exceeded acceptable levels even for just 32 users. The median latency was 3.3 seconds, and the 95th percentile was 19.4 seconds. At larger user counts, connections often failed or required reconnection. This tells us that even an elegant architecture has practical scaling limits.
What This Teaches Us
The Google Docs case study shows us that consistency and ordering are expensive. When you need every user to see the exact same state at the exact same time, you have to funnel operations through a central authority. This is a fundamental trade-off. Consistency costs latency and throughput.
For most applications, this level of consistency is not needed. A social media feed, a product catalog, or a news article can tolerate some delay in updates. But collaborative editing cannot. The choice of Operational Transformation over other approaches reflects a deliberate decision to prioritize simplicity and correctness over offline capability.
Case Study 2: JioHotstar and the IPL Final Match Crowd
The Problem
On February 23, 2025, during the India vs Pakistan Champions Trophy match, JioHotstar served 60.2 crore concurrent viewers in real time. That is 602 million people watching at the same time. During the IPL 2025 Final, the platform handled 55 million peak concurrency and 16.74 billion minutes of watch time.
To put this in perspective, Netflix peaks at around 15 to 20 million globally, and YouTube struggles beyond 10 million live viewers. JioHotstar is operating at a scale that is simply beyond what most engineers will ever encounter.
This is not a compute problem in the traditional sense. It is a network and CDN problem. The video itself must be delivered to millions of screens at the same time, and each screen has different network conditions, device capabilities, and locations.
The Architecture: A Seven-Layer Stack
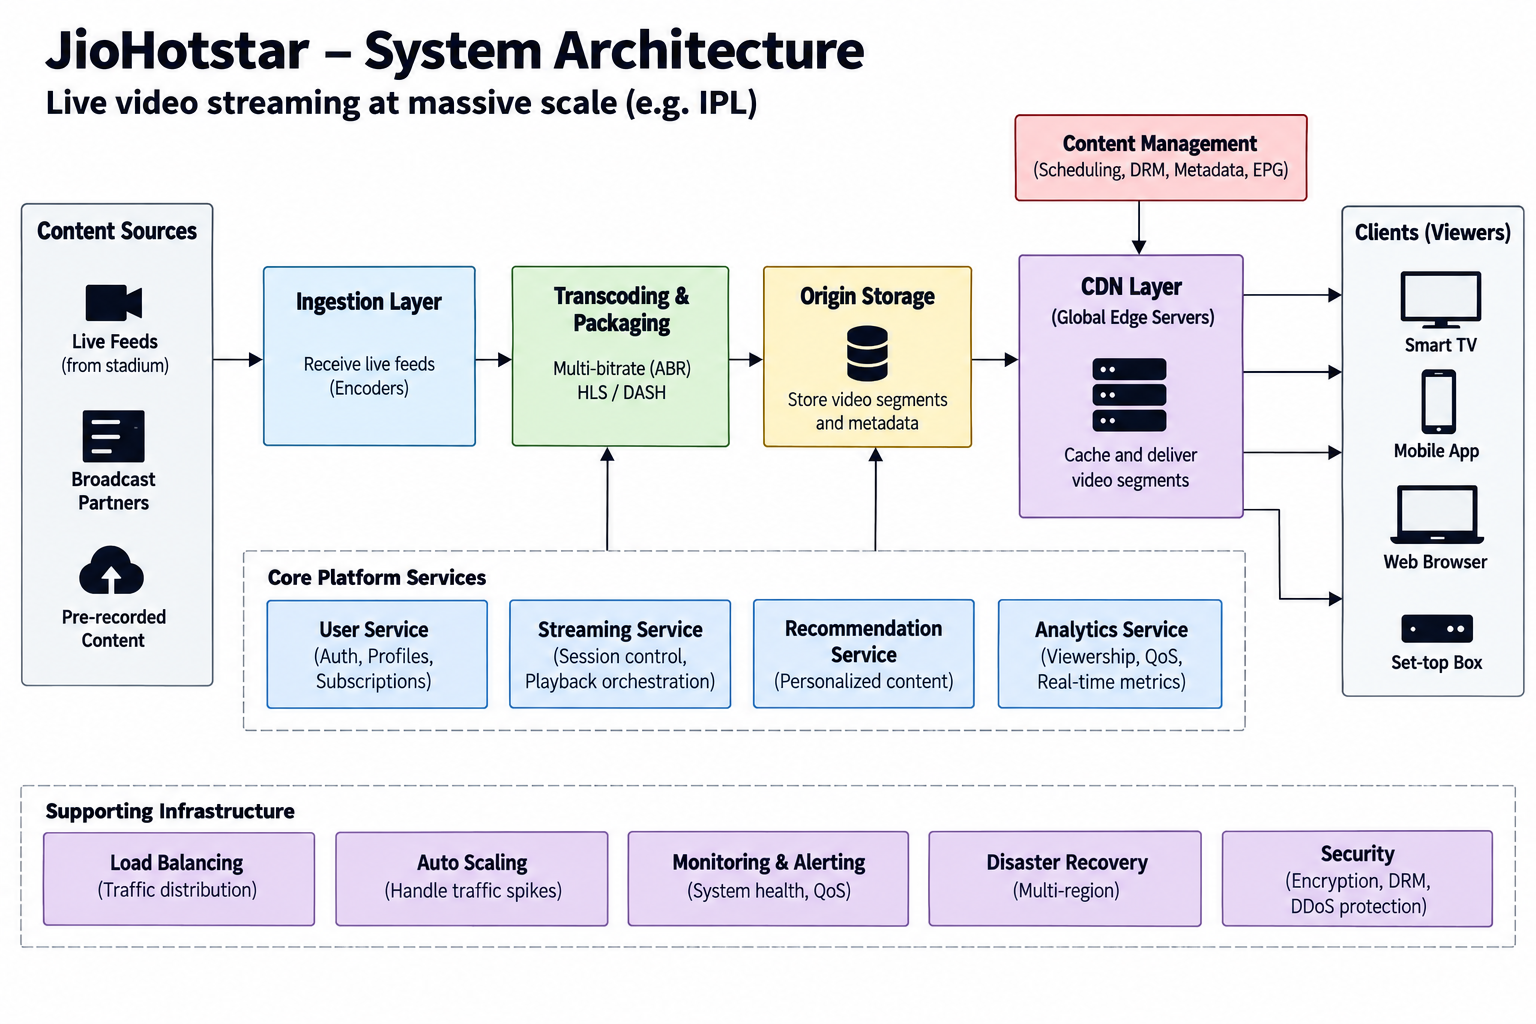
JioHotstar's architecture can be understood as a seven-layer stack. Let me walk through each layer.
Layer 1: Video Ingestion and Encoding. AWS MediaLive and MediaPackage encode over 100,000 video chunks per second from stadium cameras. The system uses Adaptive Bitrate Streaming, which means it delivers different quality levels based on each viewer's network conditions. When Virat Kohli hits a century and everyone's network spikes, the system gracefully degrades resolution instead of failing completely.
Layer 2: Multi-CDN Distribution. JioHotstar uses a combination of Akamai, CloudFront, and its own JioCDN. The goal is to achieve a 99% cache hit ratio, which means origin servers are barely touched. Most viewers never connect directly to a JioHotstar origin server. They are served by edge nodes that are physically close to their location.
Layer 3: The QoS Routing Manager. This is where JioHotstar's engineering gets really interesting. Instead of routing traffic by state or network provider, they segment users into groups called "cohorts." Each cohort is a specific combination of ASN, Country, State, City, and User Type. The QoS Routing Manager watches video metrics like Playback Failure Rate, Rebuffering, and RTT Latency in real time. It scores each CDN's performance for each cohort and dynamically adjusts traffic weights to route users to the best-performing CDN for their specific location and network conditions.
Layer 4: Microservices on Kubernetes. Over 800 microservices run on Amazon EKS, with 4,000 Kubernetes worker nodes spinning up automatically at peak. New pods can be provisioned in 30 seconds. The platform migrated from self-managed Kubernetes to EKS so they could offload control plane management and focus on workload optimization.
Layer 5: Real-Time Data Pipeline. Apache Kafka and Apache Flink process billions of events per day. Every play, pause, buffer, and skip becomes a Kafka event, processed by Flink for personalization, fraud detection, and real-time analytics.
Layer 6: Cost Optimization. Approximately 70% of EC2 instances are Spot Instances. This allows JioHotstar to achieve world-class scale at a much lower cost.
Layer 7: AI-Generated Highlights. After the match, AI generates highlights in 12 Indian languages within minutes.
The Critical Details: Pre-Warming and Panic Mode
The hardest part of JioHotstar's challenge is not the steady state. It is the spike at 7:30 PM when the match starts and 40 million people hit play within the same 4-minute window.
To handle this, JioHotstar uses several strategies.
First, they do CDN pre-warming. Before major events, the platform pre-warms CDN caches with the most likely content. This ensures that when the flood of requests arrives, the edge nodes are already populated and ready to serve.
Second, they use predictive autoscaling. Instead of reactive autoscaling, which might introduce "insufficient capacity" errors during extreme spikes, JioHotstar uses scaling strategies based on request count and platform concurrency. They also prepare for worst-case scenarios by testing with 108,000 CPUs, 216 GB of memory, and 200 GBps network output.
Third, they have a panic mode. When the system detects that it is approaching its limits, it enters a panic mode where non-critical features are disabled to keep the video playing. Recommendations, personalization, and even payment processing might be temporarily turned off to preserve the core streaming experience.
Fourth, they use rate limiting and load shedding. Traffic is rate-limited to prevent server overload. The system prioritizes essential components like video playback over everything else.
The Trade-Offs
JioHotstar's architecture prioritizes availability over feature completeness. During a major event, the platform is willing to degrade the experience, like lowering resolution or disabling recommendations, rather than failing entirely. This is a deliberate choice that reflects the business reality. A viewer who sees a slightly blurry video is still a viewer. A viewer who sees a loading spinner will leave and never come back.
The multi-CDN strategy adds complexity. Managing traffic across Akamai, CloudFront, and JioCDN requires sophisticated routing logic. But this complexity is justified by the scale. No single CDN can handle 60 million concurrent viewers in India's diverse network landscape.
What These Case Studies Teach Us
Lesson 1: Understand Your Actual Constraint
Google Docs is constrained by consistency and ordering. The bottleneck is the server that must serialize operations. JioHotstar is constrained by network bandwidth and CDN capacity. The bottleneck is the edge network that must deliver video to millions of devices.
An experienced developer identifies the actual constraint before designing the solution. A beginner might try to solve Google Docs' problem by adding more servers, when the real issue is that ordering is fundamentally centralized. A beginner might try to solve JioHotstar's problem by optimizing origin servers, when the real issue is distributing content to the edge.
Lesson 2: Design for Degradation, Not Perfection
Both systems are designed to fail gracefully. Google Docs might show "Trying to connect" when overwhelmed, but the document is not corrupted. JioHotstar might drop resolution or disable recommendations, but the video keeps playing.
The question an experienced developer asks is: "What happens when this component fails?" Not "How do I make sure it never fails?" The first question leads to resilience. The second question leads to fragile systems that shatter under unexpected load.
Lesson 3: The Last Mile is the Hardest
JioHotstar's QoS Routing Manager exists because India's network is not one uniform thing. A user on 5G in South Delhi has a vastly different experience than a user on a local ISP in rural Rajasthan. The system must treat every cohort as a unique routing decision.
This applies to any high-traffic application. The user experience is determined by the last mile, which is the network between your edge and the user's device. Experienced developers invest in observability at this layer, not just at the origin.
Lesson 4: Cost is a Design Constraint
JioHotstar's use of 70% Spot Instances is not just a cost optimization. It is a design decision. The workload is designed to be fault-tolerant and restartable, which enables the use of cheaper, interruptible compute. If the workload required long-running, stateful processes, Spot Instances would not be viable.
Experienced developers treat cost as a first-class constraint. They ask: "What is the cheapest architecture that meets the reliability and performance requirements?" Not "How do I make this as reliable as possible regardless of cost?"
How Freshers Should Approach This Instead of Vibe Coding
The Vibe Coding Trap
"Vibe coding" is the practice of building something that works in development, deploying it, and hoping it scales. It works for prototypes and personal projects. It fails catastrophically in production.
The core problem with vibe coding is that it optimizes for getting something working now rather than understanding why it works and how it will fail. A vibe coder adds a database because "I need to store data." An experienced developer asks: "What are the read and write patterns? What consistency guarantees do I need? What happens when the database goes down?"
A Structured Approach for Freshers
Step 1: Define the Non-Functional Requirements First
Before writing any code, answer these questions.
What about consistency? Does every user need to see the same data at the same time? For Google Docs, the answer is yes. For an Instagram feed, the answer is no.
What about availability? Can the system go down for maintenance, or must it be always on? For JioHotstar during IPL, it must be always on.
What about latency? How fast must a request be served? For video streaming, 2 to 6 seconds between segments is acceptable. For collaborative editing, sub-second is needed.
What about scale? How many users will access this simultaneously? What is the peak-to-average ratio?
What about cost? What is the budget per user per month?
These requirements determine the architecture. If you skip this step, you are designing blind.
Step 2: Identify the Bottleneck
Every system has a bottleneck. It might be the database, the network, the CPU, or the disk I/O. Your job is to find it before it finds you.
Use load testing tools like JMeter, K6, or Locust to simulate traffic and measure where the system breaks. JioHotstar's "Project HULK" involved load generation, performance testing, and "Tsunami tests" specifically designed to find bottlenecks before real users did.
Step 3: Design for Failure
Assume every component will fail. Design your system so that a failure in one component does not cascade into a total outage.
Use health checks and automated failover. Implement circuit breakers to prevent cascading failures. Design for graceful degradation, which means deciding what features can be disabled to keep the core service running. Test failure scenarios with chaos engineering tools.
Step 4: Instrument Everything
You cannot fix what you cannot see. Instrument your system with metrics, logs, and traces. Monitor the four golden signals: latency, traffic, errors, and saturation.
JioHotstar's ARGUS system collects heartbeat data from devices, processes it, and provides telemetry to the QoS Routing Manager. Without this observability, the dynamic routing would be impossible.
Step 5: Iterate Based on Data, Not Intuition
After deployment, monitor the system and identify actual bottlenecks. Do not optimize based on what you think is slow. Optimize based on what the metrics say is slow.
This is the difference between an experienced engineer and a vibe coder. The experienced engineer measures, analyzes, and iterates. The vibe coder guesses, patches, and hopes.
Books and Learning Resources
Recommended Books
1. Designing Data-Intensive Applications by Martin Kleppmann
This is the definitive guide to the principles behind scalable systems. It covers consistency, replication, partitioning, and the trade-offs that define distributed systems. This is essential reading for anyone who wants to understand why systems like Google Docs and JioHotstar are designed the way they are.
2. System Design Interview by Alex Xu
A practical guide to designing scalable systems, with case studies on real-world architectures. This is good for understanding the vocabulary and patterns that experienced engineers use.
3. Site Reliability Engineering by Google
This book explains how Google approaches reliability, monitoring, and incident response. The chapters on service level objectives (SLOs) and error budgets are particularly relevant for understanding how to make trade-offs between reliability and feature velocity.
Online Resources
1. High Scalability Blog
URL: highscalability.com
This blog has real-world case studies of how companies scale their systems. The archives include analyses of systems like Google Docs, Netflix, and WhatsApp.
2. AWS Architecture Center
URL: aws.amazon.com/architecture
Reference architectures and best practices for building scalable, reliable systems on AWS. JioHotstar's architecture is built on AWS, so these resources are directly applicable.
3. JioHotstar Engineering Blog
URL: blog.hotstar.com
Detailed technical posts from the JioHotstar engineering team, including their CDN routing, Kubernetes scaling, and live streaming architecture.
4. Google Docs API Documentation
URL: developers.google.com/docs
Official documentation on how Google Docs handles collaboration, including the WriteControl field for managing conflicting changes.
5. Distributed Systems Reading List
URL: github.com/theanalyst/awesome-distributed-systems
A curated list of papers, articles, and resources on distributed systems. This is good for going deeper into the theory behind these architectures.